While the market saw notable bullish action on Wednesday, Ethereum’s price struggled to attract gains as it faced a strong barrier. However, ETH’s recent price performance hints at a potential recovery, which suggests a continuation of the renewed upsurge.
Technical Chart Pattern Signals Rally For Ethereum
Ethereum has moved briefly above the $1,900 mark following market resurgence. While the upward move might not appear significant, the second-largest digital asset is showing fresh signs of strength due to an emerging bullish chart pattern on the 1-day time frame.
Specifically, Trader Tardigrade, a crypto analyst, has revealed a Bull Pennant Pattern on the 1-day chart, hinting at a possible shift in momentum. A Bull Pennant formation is a bullish technical pattern that signals a continued upward trend.
Similar to a triangular pennant, it is created when a period of consolidation occurs following a significant price increase, during which the price moves within a narrowing range. This consolidation is determined by converging trend lines, while a breakout above the upper trendline confirms the continuation of the uptrend.
According to the expert, Ethereum is currently breaking out of the bull pennant pattern after a breakout from the trendline. ETH’s surpassing the trendline indicates growing upward momentum, increasing the possibility of a significant rebound and the beginning of a new rally in the short term.

With the altcoin building strength after the breakout, Trader Tardigrade has predicted a rally back to the $2,250 level. A move above the crucial price mark is likely to trigger a prolonged uptrend and attract broader market confirmation.
In a previous post, Trader Tardigrade reported a bullish signal from the ETH’s Stochastic Indicator. Despite the prior volatile period, the Stochastic indicator is showing a potential rebound from the oversold zone. ETH’s price is also exhibiting a similar move as it gears up for a bounce to $3,200.
Trader Tardigrade’s prediction is based on past trends where ETH’s price surged as the stochastic indicator recovered from an oversold zone. As observed in the past, the development occurred 3 times within the last 2 years, triggering over 100%, 169%, and 99% upswings, respectively.
Spot Volume For ETH Cooling Off
Amid previous bearish price movements, Ethereum Spot volume experienced a steady decline. However, Darkfost, an on-chain expert and author, highlighted that the cool-off “might actually be a good sign.”
Darkfost has underlined two interesting metrics. He noted that bubbles are used to represent spot volume, and the larger the bubble, the higher the volume. Also, the rate of volume change is represented by the color of each bubble.
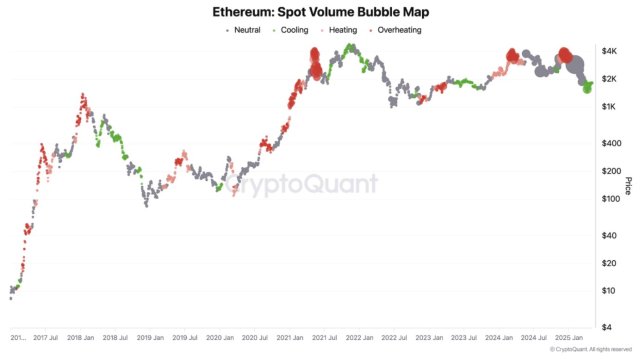
Given that ETH has recently been undergoing a correction, its spot volume drop in such a context might aid in reducing volatility. Consequently, this may help alleviate the selling pressure that has been influencing the market. In order to prevent misconceptions, Darkfost has stated that the development does not mean that ETH has reached a bottom, urging investors to stay cautious.

You can get bonuses upto $100 FREE BONUS when you:
💰 Install these recommended apps:
💲 SocialGood - 100% Crypto Back on Everyday Shopping
💲 xPortal - The DeFi For The Next Billion
💲 CryptoTab Browser - Lightweight, fast, and ready to mine!
💰 Register on these recommended exchanges:
🟡 Binance🟡 Bitfinex🟡 Bitmart🟡 Bittrex🟡 Bitget
🟡 CoinEx🟡 Crypto.com🟡 Gate.io🟡 Huobi🟡 Kucoin.


Comments