Ethereum is struggling below $1,700 as aggressive selling pressure defines the market structure and the recovery that once appeared to be building has now given back a significant portion of its gains. The price is at levels that are testing the resolve of holders who maintained positions through the earlier correction — and CryptoQuant data has surfaced a signal in the exchange reserve data that adds a structural layer to the current weakness worth examining carefully.
The Ethereum Exchange Reserve chart across all exchanges tells a specific and directional story. The total amount of ETH held across centralized exchanges continues to maintain a steady downward trend following the previous upward rally. The supply that briefly moved onto exchanges — creating the overhead pressure that contributed to the decline from the mid-May highs — has not been replenished by fresh inflows. The reserve is declining rather than building, and crucially, there are no sudden spikes in exchange-directed deposits that would indicate a new wave of selling preparation from large holders.
That absence of sudden inflow spikes is the detail that prevents the current price weakness from being straightforwardly attributed to aggressive new distribution. The price is falling below $1,700 — but the exchange infrastructure that would typically show signs of coordinated large-scale selling is not registering the kind of deposit activity that would confirm that interpretation.
The CryptoQuant data describes a market where the selling pressure is real, but the supply mechanics behind it are more nuanced than the price action alone suggests.
Supply Is Leaving Exchanges
The CryptoQuant analysis names the gap that explains why declining exchange reserves have not translated into price recovery. The supply dynamic is constructive — ETH continuing to leave exchanges reflects a long-term accumulation sentiment among investors who are choosing self-custody over exchange proximity. That behavioral commitment to holding rather than selling is the structural foundation that limits how far the decline can extend before the available sell-side inventory becomes genuinely thin.

But structural support and active demand are different conditions — and the market currently has the former without the latter. The decrease in exchange supply has not yet reached the threshold where reduced availability alone creates the price response that would confirm a trend reversal. Demand must arrive to meet the tightening supply before that dynamic produces upward price movement rather than simply a slower decline.
The price chart’s continued downward trajectory below $1,700 is the honest expression of that demand absence. Investors withdrawing ETH from exchanges are expressing a long-term view about where the asset is headed. The market’s short-term price mechanism requires active buyers — participants willing to pay current prices — to validate that view in the near term.
The CryptoQuant assessment is patient rather than alarming. The market needs more time to find a new equilibrium and build the momentum that converts declining exchange supply from a structural positive into an active price catalyst. The foundation is being laid. The demand that activates it has not yet appeared in the data.
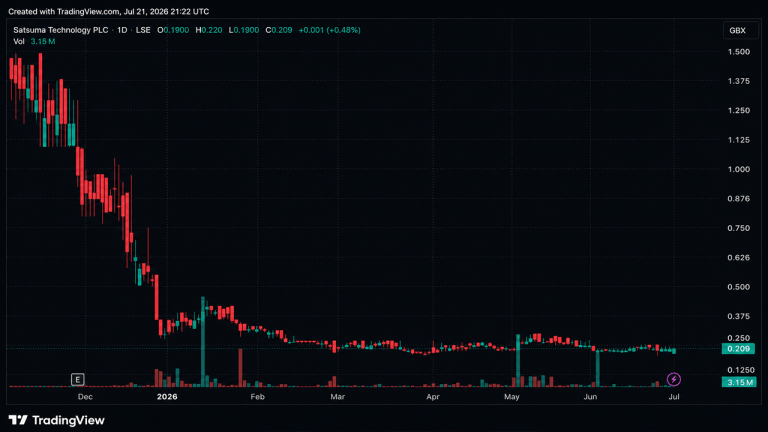
Ethereum Breaks Below Key Support As Bears Target Cycle Lows
Ethereum has suffered a major technical breakdown, falling below the February lows and invalidating the multi-month range that had defined price action since the capitulation event earlier this year. ETH is now trading near $1,675 after losing the $1,800-$1,850 support zone, which had previously acted as the floor for the February-to-May consolidation structure.

This breakdown is significant because the market is no longer simply retesting a known demand area. It has moved below it. That means Ethereum is now in a weaker technical position, with price entering territory not defended during the prior recovery attempt. The failed support zone around $1,800-$1,900 now becomes immediate resistance, and any bounce into that area will likely test whether buyers can reclaim the previous range or whether sellers use it as a distribution zone.
The broader structure remains clearly bearish. ETH trades below the 50-, 100-, and 200-day moving averages, all of which are positioned above price, reinforcing overhead resistance. The rejection from the $2,250-$2,350 supply zone in May now looks like the final lower high before the current breakdown.
Volume has expanded during the selloff, confirming that the move reflects active selling pressure rather than thin liquidity alone. With February lows broken, the next downside levels are less clearly defined on this chart. Bulls now need to recover $1,800 quickly to avoid confirming a deeper continuation lower.
Featured image from ChatGPT, chart from TradingView.com

You can get bonuses upto $100 FREE BONUS when you:
💰 Install these recommended apps:
💲 SocialGood - 100% Crypto Back on Everyday Shopping
💲 xPortal - The DeFi For The Next Billion
💲 CryptoTab Browser - Lightweight, fast, and ready to mine!
💰 Register on these recommended exchanges:
🟡 Binance🟡 Bitfinex🟡 Bitmart🟡 Bittrex🟡 Bitget
🟡 CoinEx🟡 Crypto.com🟡 Gate.io🟡 Huobi🟡 Kucoin.


Comments